
How to Do a Percolation Test for Septic (2026 Guide)
The Most Overlooked Factor in Septic System Health
Most homeowners think about septic system maintenance in terms of the tank: pumping schedules, bacterial health, scum and sludge levels. These are important — but the single most important determinant of whether a septic system can function over the long term is not the tank. It’s the soil beneath the drain field.
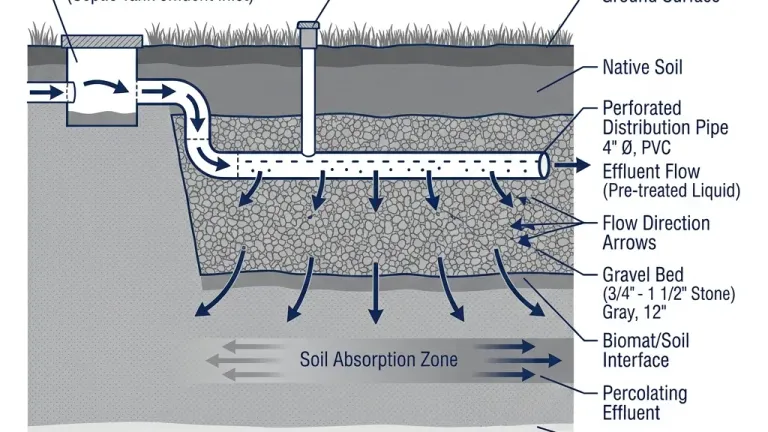
The soil is where the final treatment of septic effluent occurs. It’s where pathogens are filtered, where nitrogen compounds are transformed, and where treated effluent eventually re-enters the groundwater cycle. A well-maintained tank connected to inadequate soil is still a failing system. A modestly maintained tank connected to excellent soil can often absorb a remarkable amount of operational neglect.
Understanding soil percolation — what it is, how it’s measured, and what drives it — gives homeowners insight into the actual long-term vulnerability of their system that no inspection of the tank itself can provide. Learn where percolation data appears in your report.
What a Percolation Test Measures
A soil percolation test (perc test) measures the rate at which water is absorbed into the soil at a standardized test hole. The protocol, established by state environmental agencies and based on guidance from the National Environmental Health Association, involves:
- Digging cylindrical test holes to the depth of the proposed drain field (typically 18–36 inches)
- Pre-saturating the holes with water for a standardized period (typically 24 hours) to simulate saturated field conditions
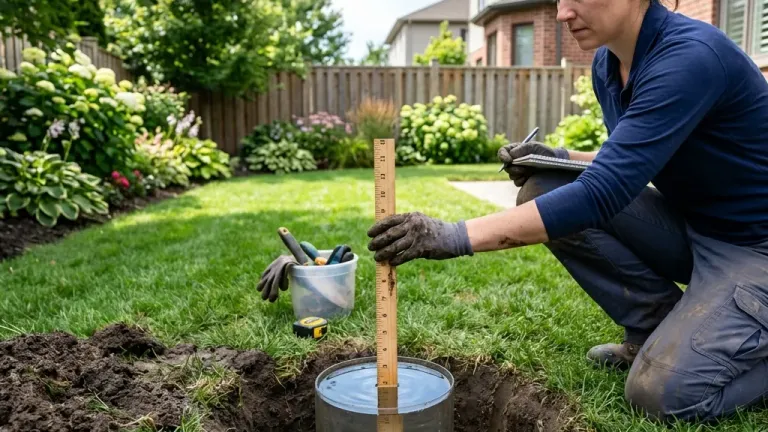
- Adding a measured volume of water and recording how long it takes for the water level to drop a measured increment
The result is expressed as a percolation rate — typically in minutes per inch (mpi) — which describes how many minutes it takes for the water level to drop one inch.
↔ Scroll horizontally to see full comparison table
| Percolation Rate | Soil Classification | Implication |
|---|---|---|
| [object Object] | Very rapid (gravelly/sandy) | May need special design to prevent pollutants from moving too quickly |
| 1–30 mpi | Suitable (most loam soils) | Standard drain field design applicable |
| 30–60 mpi | Marginally suitable | Larger field area required |
| 60–120 mpi | Marginal | Alternative system design required |
| > 120 mpi | Unsuitable (clay-dominant) | Conventional drain field not permittable |
Tip: You can input your raw measurements into our percolation rate calculator to automatically determine your mpi and soil classification.
How to Do a Percolation Test Yourself: Step-by-Step Protocol
Before you start digging, gather the right equipment. Precision matters.
- Post-hole digger or auger: For digging precise cylindrical holes.
- Tape measure or yardstick: To measure water levels accurately.
- Stopwatch or timer: For consistent interval recording.
- Bucket and water source: You will need a significant amount of water (10-20 gallons per hole).
- Clean gravel (pea gravel): To prevent scouring the bottom of the hole when pouring water.
- Notepad and pen: To record your measurements.
Before you dig even a single test hole, you must call your local utility marking service (811 in the US) to mark underground lines. Digging blindly can result in severe injury or thousands of dollars in utility repair costs.
— National Ground Water Association
Step 1: Dig the Test Holes
A single hole does not provide an accurate average for an entire drain field area.
- Dig 3 to 6 holes evenly spaced across the proposed drain field area.
- Each hole should be 6 to 12 inches in diameter.
- Dig to the depth of the proposed drain field trenches (typically 24 to 36 inches deep).
- Scarify (scratch) the sides and bottom of the holes with a sharp tool to remove any smeared clay or compacted soil caused by the digging process. Smeared soil acts like a ceramic pot and blocks water absorption, ruining the test.
- Place 2 inches of clean pea gravel at the bottom of each hole. This protects the soil bottom from scouring and sealing when you pour water in.
Step 2: Presoak the Soil
You cannot measure percolation in dry soil. The soil must be saturated to simulate the worst-case scenario: a drain field operating during the wet season.
- Carefully fill each hole with clear water up to at least 12 inches above the gravel.
- Keep the hole filled for at least 4 hours, ideally overnight.
- If the water drains away completely in less than 10 minutes during the presoak, you have extremely sandy/gravelly soil, and you can proceed immediately to the test without waiting overnight.
- For all other soils (loam, clay), allow the soil to swell and saturate overnight (at least 12 hours) before proceeding.
Step 3: Conduct the Measurement
Once the soil is pre-soaked and swollen, the actual test begins.
- Fill the hole with exactly 6 inches of water above the gravel layer.
- Using your tape measure, record the exact water level from a fixed reference point at the top of the hole.
- Start your timer.
- For sandy/fast-draining soil: Measure the water drop every 10 minutes for 1 hour. Refill to 6 inches after each measurement if it drains too quickly.
- For normal/slower soil: Measure the water drop every 30 minutes for 4 hours.
- The percolation rate is calculated from the final reading (the last 10-minute or 30-minute interval), as this represents the stabilized absorption rate.
Step 4: Calculate Your Perc Rate (MPI)
The result of a percolation test is expressed in Minutes Per Inch (MPI). It tells you exactly how many minutes it takes for the water level to drop one inch.
If the water dropped 0.5 inches in the final 30-minute interval:
30 minutes ÷ 0.5 inches = 60 MPI
Calculate Your Percolation Rate Instantly
Enter your test hole measurements and get your soil's absorption rate in minutes per inch — with a pass/fail determination for standard septic drain fields.
Read the Full GuideThe Soil Science Behind Percolation
The perc rate is a practical measurement, but it reflects underlying soil properties that are worth understanding directly:
Soil texture — the relative proportions of sand, silt, and clay particles — is the primary determinant of baseline percolation capacity. Sandy soils have large pore spaces and absorb water quickly. Clay soils have very small pore spaces and absorb water slowly or not at all.
Soil structure — how individual particles aggregate into larger units — dramatically modifies what texture alone would predict. A well-structured clay loam with strong aggregate development can perform significantly better than its particle size distribution would suggest, because macro-pores between aggregates provide preferential flow paths.
Organic matter content — acts as a biological glue, supporting aggregate development and pore stability. Soils with higher organic matter content tend to maintain structural integrity over time. Soils that receive high sodium inputs (from water softener discharge, for example) lose organic matter binding capacity and become dispersed. You can read more about how sodium affects clay percolation.
Depth to seasonal high water table — arguably as important as percolation rate itself. State regulations typically require a minimum vertical separation (often 2–4 feet) between the bottom of the drain field trench and the seasonal high water table. Insufficient separation means effluent cannot receive adequate soil treatment before reaching groundwater.
What Perc Test Results Don’t Tell You
The percolation test, despite its central role in septic system permitting, has well-documented limitations:
Point-in-time measurement: A perc test measures current soil conditions on the day of the test. Soil permeability changes seasonally (higher water tables in spring reduce effective drainage), and degrades over time as biomat forms at the trench bottom. Understand what happens when percolation rates drop to avoid surprises.
Single-depth assessment: Standard perc testing assesses conditions at a single depth. Stratified soils — which have permeable layers overlying impermeable horizons — can produce deceptively favorable perc rates at the test depth while having a significant barrier just below.
No assessment of long-term soil loading capacity: A perc test tells you how fast water moves through soil today. It does not predict how that rate will change as organic solids accumulate at the soil-gravel interface over years of system use. However, you can review how biological treatments restore soil permeability.
Implications for Long-Term Maintenance
Understanding your site’s percolation profile has direct implications for maintenance strategy. Use our free tool to calculate your soil percolation rate and see exactly what your test numbers mean:
Sites with fast percolation (< 5 mpi, typically sandy): Highly permeable soils absorb effluent quickly but provide less treatment distance before groundwater. These sites benefit most from excellent tank biological health — because the soil itself provides limited pathogen removal.
Sites with moderate percolation (5–30 mpi, loam soils): These are the design sweet spot for conventional systems. Normal maintenance schedules apply, with biological supplementation offering measurable performance improvement.
Sites with slow percolation (30–60 mpi): These systems are operating at their designed limits and are most sensitive to any additional stress — increased organic loading, biological disruption, or water softener salt discharge. These homeowners benefit most from aggressive preventative biological maintenance and reduced household water loading. Learn how poor percolation increases maintenance costs in these marginal systems.
If you do not know your property’s perc test results, this information should be on file with your county or municipal building department as part of the original septic system permit. It is worth retrieving.
- Soil Percolation Rate Guide � Specific targets for healthy soil percolation.